


What is the current state (2026) of AI implementation within
industrial manufacturing in the United States?
Date: January 15, 2026
Writer: Mike Dolan
White Paper – FSC Business Consulting
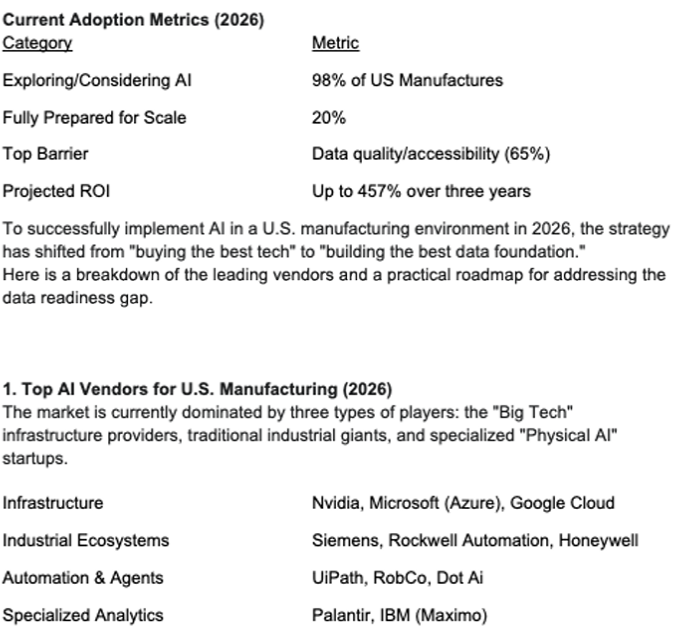
In 2026, the implementation of AI in U.S. industrial manufacturing has shifted from
“experimental” to “operational.” While almost every major manufacturer is now using
some form of AI, the industry is currently navigating a “maturity gap” between basic
automation and fully autonomous systems.
The current landscape is characterized by three major trends:
1. The Rise of “Agentic AI” and Execution
In previous years, AI was primarily used for “prediction” (telling you something might
break). In 2026, the focus has moved to execution.
• Agentic AI: Autonomous systems are now beginning to coordinate workflows
across multiple systems (e.g., an AI agent spotting a supply delay and automatically
rescheduling production and technician shifts).
• Operational Integration: 73% of manufacturers now view themselves as being
“on par” or “ahead” of their peers in AI adoption, moving beyond isolated pilots to
embedding AI into core shop-floor operations.
2. Primary Use Cases in 2026
The most successful implementations are currently found in these areas:
• Predictive Maintenance & Digital Twins: These are no longer niche. AI-powered
digital twins—virtual replicas of factories—are used to simulate changes before they
happen, reducing equipment failure by up to 40%.
• Intelligent Quality Control: Computer vision systems now detect microscopic
defects in real-time on assembly lines, cutting defect rates by nearly 50%.
• Generative AI for Design: Manufacturers are using GenAI to “evolve” product
designs based on past performance data and customer feedback, significantly
shortening the R&D cycle.
3. The “Preparedness Gap” and Barriers
Despite the high adoption rate, a significant gap remains between intent and
readiness:
• Data Readiness: While 98% of manufacturers are exploring AI-driven automation,
only about 20% feel “fully prepared” to scale it. The biggest hurdle is “fragmented
data”—information trapped in old spreadsheets or disconnected legacy software.
• The Talent Shortage: Approximately 33% of companies cite a lack of internal
talent as their primary barrier. This has led to a surge in “Low-Code/No-Code” AI
tools designed for factory floor workers rather than data scientists.
• Workforce Sentiment: Around 52% of employees express concern about job
replacement, prompting companies to pivot toward “AI-Assisted” models where AI
acts as a “co-pilot” for human workers rather than a replacement.
2. Strategy: Closing the “Data Readiness” Gap
The #1 reason AI projects fail in manufacturing is not the algorithm; it is fragmented
data (information stuck in isolated machines or outdated spreadsheets). Here is how to
fix it:
Phase A: The Data Audit (Weeks 1-4)
• Inventory Your Silos: Identify where data lives—ERP systems, local xcel files, or
proprietary sensor logs.
• Bridge the OT/IT Divide: Create a unified “Data Lakehouse” (using tools like
Databricks or Snowflake) where Operational Technology (shop floor) and
Information Technology (office) data can finally talk to each other.
• Contextualize Everything: A temperature reading of “180°C” is useless unless
the AI knows which machine it came from, who was operating it, and what product
was being made at the time.
Phase B: Implementing “Agentic” Governance (Months 2-5)
• Assign Data Owners: In 2026, the best practice is Joint Ownership between IT
and Production. If the maintenance manager doesn’t “own” the quality of the sensor
data, the AI will never be accurate.
• Automate Quality Checks: Use “Data Observability” tools to automatically flag if
a sensor starts drifting or sending “garbage data” before it reaches your AI models.
Phase C: Start Small, Scale Fast
• The “Pilot to Platform” Approach: Don’t try to automate the whole factory. Pick
one high-value bottleneck (e.g., a high-scrap injection molding line) and build a
“Minimum Viable Product” (MVP).
• Low-Code Integration: Use platforms like Microsoft Power
Automate or Make to allow your existing engineers—not just data scientists—to
build simple AI workflows.
Key Metric for Success: “Time to Truth”
In 2026, the gold standard for data readiness is your Time to Truth: how long it takes
for a raw sensor signal to become a business decision. Highly mature manufacturers
have reduced this from days to seconds.
Strategy to Action
To move from strategy to action, you need a high-impact, low-risk Pilot Project. For
most U.S. manufacturers in 2026, the gold standard for a first pilot is AI-Powered
Predictive Maintenance (PdM).
Below is a 90-day execution roadmap designed to prove ROI before scaling.
90-Day Pilot Outline: Predictive Maintenance
Objective: Reduce unplanned downtime on a single “bottleneck” asset by 15% within
three months.
Phase 1: Selection & Instrumentation (Days 1–30)
• Asset Selection: Choose a “Goldilocks” machine—one that is critical enough to
matter (e.g., a primary CNC mill or injection molder) but not so complex that it has
1,000+ variables.
• Sensor Audit: Ensure the asset has the “Big Three”
sensors: Vibration, Temperature, and Power Consumption.
• The “Context” Layer: Connect your Maintenance Management System (CMMS)
so the AI knows when the last service occurred. Without this, the AI might mistake a
routine oil change for a machine failure.
Phase 2: Data Baseline & “Normal” Training (Days 31–60)
• Establishing “Normal”: Feed 30 days of clean sensor data into an AI model
(like Azure Machine Learning or Siemens Senseye) to learn the machine’s unique
“heartbeat.”
• Anomaly Detection: Instead of fixed thresholds (e.g., “Alert if > 100°C”), the AI
identifies patterns (e.g., “The temperature is rising 5% faster than usual given the
current load”).
• Human-in-the-Loop: Have your senior technicians “label” the data. If the AI flags
a vibration, the tech confirms: “Yes, that was a bearing wearing out,” or “No, we
were just running a heavier material.”
Phase 3: Actionable Insights & ROI (Days 61–90)
• The “Copilot” Interface: Deliver alerts via a simple mobile dashboard for floor
supervisors.
• Agentic Trigger: (2026 Best Practice) Integrate the AI with your parts inventory. If
a failure is predicted in 10 days, the AI should automatically check if the necessary
spare part is in stock.
• Final Review: Compare the cost of the pilot against the “avoided cost” of a single
unplanned shutdown.
2026 Success Metrics (KPIs)
To get approval for a full-scale rollout, you must report these three specific numbers:
1. Lead Time to Failure: How many hours/days of warning did the AI provide
before a potential breakdown?
2. False Positive Rate: How often did the AI cry wolf? (Aim for < 5%).
3. Time-to-Action: Once an alert was sent, how long did it take for a work order to
be created?
Potential Pitfall: The “Pilot Purgatory”
Many companies get stuck in a loop of endless testing. To avoid this, define your “Exit
Criteria” now. > Example: “If this pilot prevents 2 hours of downtime and has a false
positive rate under 10%, we will immediately green-light Phase 2 (deployment to the
entire production line).”
To launch your Pilot Project effectively, you need two things: the physical “nerves”
(hardware) and the “buy-in” (human trust). In 2026, successful implementations
prioritize rugged simplicity and transparent communication.
1. Hardware Checklist: The “Pilot Kit”
For a standard bottleneck asset (e.g., a CNC machine or motor-driven conveyor), you
will need the following industrial-grade components:
A. The Sensors (The “Big Three”)
• Vibration (Triaxial Accelerometer): Look for MEMS-based sensors with triaxial
measurement.
• Requirement: Frequency range of 2 Hz to 10 kHz to catch both low-speed
imbalance and high-frequency bearing wear.
• Standard: IP68/69K rating (water/dustproof).
• Temperature (Contact or IR): Digital thermocouples or infrared sensors.
• Requirement: Accuracy within ±1°C. Ensure it is mounted as close to the
bearing housing or motor casing as possible.
• Power Consumption (CT Clamps): Non-invasive Current Transformers (CT) that
clip around the machine’s power leads.
• Requirement: Real-time amperage and voltage tracking to detect “motor
strain” before heat or vibration even starts.
B. The Connectivity Layer
• IIoT Gateway: A “Universal Translator” device (e.g., MachineMetrics, HMS
Ewon, or Advantech).
• Spec: Must support MQTT Sparkplug B or OPC UA protocols for future
proofing.
• Connectivity: In 2026, Wi-Fi 6 or Private 5G is preferred to avoid interference
in dense metal environments.
• Edge Compute Module: A small industrial PC (like a Siemens Nanobox) to
process data locally, ensuring the AI works even if the factory’s internet blips.
2. The “Human-in-the-Loop” Script
The biggest threat to your pilot is the “Black Box” effect—operators feeling like a
machine is spying on them or replacing their intuition. Use this script to frame the
project to your shop floor team:
The “Co-Pilot” Pitch (sample)
The Script:
“Team, we’re starting a 90-day pilot on this machine. I want to be clear: this isn’t here to
monitor you; it’s here to monitor the machine’s health.
Right now, when this machine goes down, we’re all in ‘firefighting mode.’ It’s stressful, it
ruins the schedule, and it’s usually something we could have fixed in 20 minutes if we’d
known about it yesterday.
We’re giving this machine a ‘nervous system.’ These sensors are going to act like a Co
Pilot for you. If the AI detects a weird vibration that a human ear can’t hear yet, it’s
going to ping your tablet. It’s like having an expert mechanic watching the internals 24/7.
Your Role: The AI is a ‘rookie.’ It’s going to see things it doesn’t understand. If it sends
an alert and you look at the machine and say, ‘That’s just the normal startup hum,’ tell
the system it’s wrong. You are the ones training it to be useful to you.”
3. Implementation “Pro-Tips” for 2026
• Magnetic Mounts over Tape: For the pilot, use high-strength magnetic sensor
mounts. They allow you to move sensors around to find the “sweet spot” before you
drill and tap for permanent bolts.
• The “One-Screen” Rule: Do not give operators a new login. Integrate AI alerts
into the communication tools they already use (e.g., Microsoft Teams, Slack, or their
existing CMMS dashboard).
• Celebrate the “Near Miss”: The moment the AI predicts a failure and you fix it
during a scheduled break, make a big deal out of it. Show the team the data trace
of the “saved” machine.
To secure budget for a 2026 AI rollout, you must pivot from “technical potential” to “hard
financial recovery.” In the current industrial climate, CFOs are looking for Total Cost of
Ownership (TCO) versus Avoided Loss.
Here is a template to calculate and present the ROI for your Predictive Maintenance
(PdM) pilot.
1. The ROI Calculation Formula
In industrial AI, we use the Net Avoided Cost formula (the Net Avoided Cost is a Key
Performance Indicator (KPI) used to determine the financial benefit of a proactive
measure such as, preventative maintenance or process improvement, by comparing the
cost of that measure against the expenses that would have been incurred otherwise.) :
Unplanned Downtime Saved + Asset Life Extension – Pilot Cost
ROI = ————————————————————————————— X 100
Pilot Cost
2. ROI Projection Example (One Machine)
If your bottleneck machine fails once a month for 4 hours, your current annual cost is:
• Lost Production: 48 hours × $10,000/hr = $480,000
• Emergency Repairs: (Parts + OT Labor) = $40,000
• Total “Business as Usual” Loss: $520,000/year
With the AI Pilot:
If the AI catches 80% of those failures and allows you to fix them during scheduled
downtime (where the cost of downtime is effectively $0), you save $416,000 in
production value alone.
3. Visualizing the Data Flow
To explain why this investment works to non-technical stakeholders, it helps to show
how the data moves from the physical machine to the financial bottom line.
4. The “CFO-Ready” Pitch Deck Slide
When you present this, use these three bullet points to move the needle:
• From Reactive to Proactive: “Last year, we spent $520k reacting to this
machine. This pilot shifts that spend into a $30k controlled investment.”
• The “Multiplier” Effect: “Once we prove the logic on this CNC mill, scaling to the
other 10 units costs 60% less per unit because the data infrastructure is already
built.”
• Risk Mitigation: “This isn’t just about money; it’s about meeting our delivery
contracts. One major failure in Q3 could cost us our Tier-1 supplier status.”
5. Summary Checklist for the Meeting
• [ ] The “Pain” Figure: Know exactly what 1 hour of downtime costs your specific
plant.
• [ ] The “Time to Value”: Remind them that this is a 90-day proof, not a 2-year
project.
• [ ] The “Scaling” Vision: Show a map of the factory with 5 other “Candidate
Machines” highlighted.


More Stories
Bowling Tournament Saturday July 11, 2026
Nature Coast Manufacturers’ Association Clay Shoot 2026 winning teams.
Nature Coast Manufacturers’ Association Clay Shoot 2026